How to find data representation in chemistry
Practice Questions
ACT Science › How to find data representation in chemistry
During digestion, the energy in food is converted to energy the body can use. Scientists use calorimetry experiments to measure the calories, or energy, provided by food when it is digested or burned.
The relationship used to find the heat transferred energy ")


In this experiment, food was burned over a Bunsen burner under a can of 200 ml of water. The temperature change of the water and mass change of the food can be used to determine the calories in four different food items.
Table 1 shows the values of the change of mass of the food items, the change in temperature of the water and the energy. Table 2 shows the energy to mass ratio of three of those food items.
Table 1
Roasted Peanut Peanut Cracker Cheese Puff
Water Temp. Initial 23.9 °C 33.2 °C 40.3 °C 53.9 °C
Water Temp. Final 30.0 °C 40.9 °C 55.9 °C 62.8 °C
Food Mass Initial 0.69 g 0.61 g 3.21 g 1.22 g
Food Mass Final 0.38 g 0.21 g 0.91 g 0.48 g
Energy 1.22 Cal 1.54 Cal 3.12 Cal 1.78 Cal
Table 2
Sample Energy to Mass Ratio (Cal/g)
1 1.36
2 3.93
3 2.40
According to information from Tables 1 and 2, order the samples' energy to mass ratios from least to greatest.
During digestion, the energy in food is converted to energy the body can use. Scientists use calorimetry experiments to measure the calories, or energy, provided by food when it is digested or burned.
The relationship used to find the heat transferred energy ")
In this experiment, food was burned over a Bunsen burner under a can of 200 ml of water. The temperature change of the water and mass change of the food can be used to determine the calories in four different food items.
Table 1 shows the values of the change of mass of the food items, the change in temperature of the water and the energy. Table 2 shows the energy to mass ratio of three of those food items.
Table 1
Roasted Peanut Peanut Cracker Cheese Puff
Water Temp. Initial 23.9 °C 33.2 °C 40.3 °C 53.9 °C
Water Temp. Final 30.0 °C 40.9 °C 55.9 °C 62.8 °C
Food Mass Initial 0.69 g 0.61 g 3.21 g 1.22 g
Food Mass Final 0.38 g 0.21 g 0.91 g 0.48 g
Energy 1.22 Cal 1.54 Cal 3.12 Cal 1.78 Cal
Table 2
Sample Energy to Mass Ratio (Cal/g)
1 1.36
2 3.93
3 2.40
The student performing the experiment concluded that eating an amount of crackers would provide an athlete with more energy than eating the same amount of any of the other food samples. Do the results in Tables 1 and 2 support this claim?
A student performed the following procedures to study various photosynthetic pigments (light-absorbing chemicals) in tree leaves and the wavelengths of light they absorb.
Experiment 1:
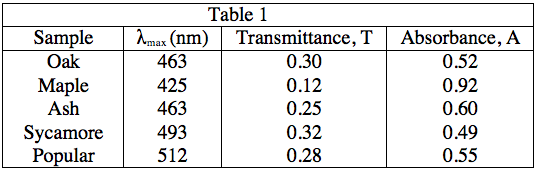
The student obtained samples of leaves from oaks, maples, ashes, sycamores, and poplars. Each leaf sample was ground separately with a mortar and pestle to release the pigments, and then each sample was suspended in water to make a colored solution of the pigment. The student then measured the absorption spectrum (a graph of how much light is absorbed by a pigment at varying wavelengths of light) of each solution in a device called a spectrophotometer. The setup of a spectrophotometer is shown below in Diagram 1.
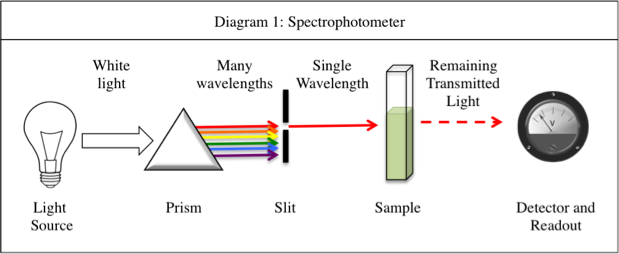
The light source emits white light, which is split into its various wavelengths by the prism. Next, a slit, which can be moved up or down to select a particular wavelength, is used to transmit just a single wavelength to the sample. The sample absorbs a fraction of this light that is characteristic to the pigment in the sample, and the rest is transmitted to the detector for a readout. Using the spectrophotometer, the student found the λmax (the wavelength of light in nanometers (nm) that the pigment absorbs most intensely, for each sample) and recorded the results in Table 1. Table 1 also shows the transmittance and absorbance values at λmax. Transmittance, T, is defined as the fraction of light, expressed as a decimal, which passes through the sample. Absorbance, A, is given by:
A = –log(T) or 10–A = T
Experiment 2:
A student is given a leaf from an unknown source. She crushes and extracts the pigment according to the procedure in Experiment 1. Measuring the absorbance spectrum in the spectrophotometer produces the following readout, shown in Diagram 2.
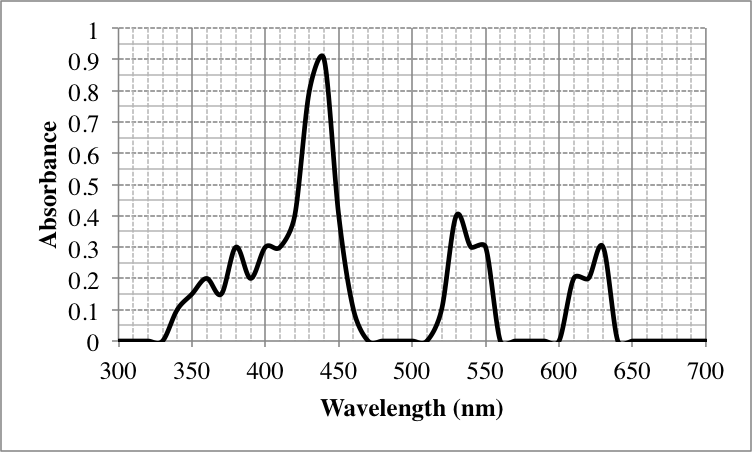
Diagram 2
Which of the following leaves most likely have the same pigment in high quantities?
Phase diagrams show what state of matter (solid, liquid, or gas) a chemical compound is in for a given temperature and pressure. Compounds 


The triple point is the temperature and pressure at which a compound exists simultaneously in all three states of matter and is found on the phase diagram where the three curves intersect.

Which answer choice ranks the Compounds A-C in order of increasing triple point temperatures?

The rate of a reaction is defined as the rate at which the products of a reaction are produced. A researcher wants to investigate the rate of reaction of the combustion of theoretical compound 

The results of the experiment are shown in the table below. The brackets (\[\]) indicate concentration measured in mol/L.

According to the data, what is the apparent relationship between oxygen concentration and the rate of the reaction?
Chemists can model how solids, liquids, and gases behave at different temperatures and pressures with a graph called a phase diagram. When the pressure and temperature are simultaneously known, a scientist can predict whether the material will be in a specific state. The diagram is divided into sections depending on the phase and the lines between sections represent phase transitions occurring between two or more separate phases.
In general, solids of neatly stacked molecules exist when temperatures are low and pressures are intermediate. These values decrease the kinetic energy of the molecules enough to allow for attractive forces to begin the stacking process. Liquids, by contrast, are found at intermediate pressures and temperatures. The temperature is high enough to impart enough kinetic energy to prevent solid formation and the pressure is high enough to prevent the liquid from becoming a gas. Finally, a gas forms at low pressures and high temperatures. The high level of kinetic energy prevents molecules from associating with one another.
Materials can undergo processes called phase transitions, meaning they can transition from one phase to another. The transition from a solid to a liquid is called melting, while the reverse transition is called freezing. Vaporization occurs when a liquid becomes a gas, while condensation occurs when a gas becomes a liquid. Finally, in a process called sublimation, a solid can directly become a gas without passing through a liquid phase. Additionally, when a gas directly becomes a solid, this is known as deposition.
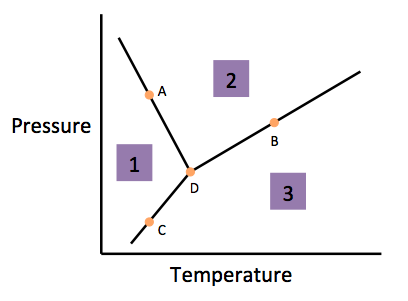
According to the figure, the material represented by Area 1 is in what phase?
Current high levels of fossil fuel use, including coal-burning power plants and gasoline-powered automobiles, have helped contribute to the high concentrations of sulfur trioxide, SO3, found in the atmosphere. When sulfur trioxide and water interact, they can undergo the following chemical reaction to produce sulfuric acid, which is the main contributor to acid rain worldwide:

Acid rain showers are particularly common near coal-burning power plants and large cities. These showers are responsible for significant economic damage to sidewalks, roads, and buildings. Scientists interested in studying the effects of acid rain often use basic substances like calcium carbonate, the main component of limestone buildings, and expose them to varying volumes of acid rain to determine what volume of acid rain is necessary to begin to erode a building. A sample graph of one scientist’s experiment is replicated below:
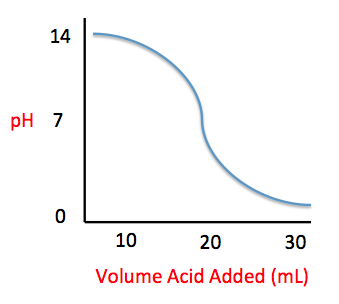
Measuring acid and base levels is commonly done with a scale called pH, which uses the concentration of hydrogen ions to determine the acidity. Hydrogen ions are in a balance with hydroxide ions to give a scale with a range from 0 to 14. Values equal to or between 0 and 6.9 represent the acidic range where hydrogen ions predominate and values equal to or ranging from 7.1 and 14 represent the basic range where hydroxide ions predominate. Thus, the more hydrogen ions present, the more acidic the solution.
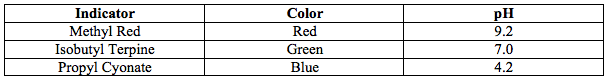
Scientists can tell when a titration (pH) experiment passes a certain pH using compounds called indicators. Indicators are usually colorless at pH levels below that of their specified color change. A table of indicators used by the above scientists and the pH at which they change colors is presented below.
What is the pH of a solution containing calcium carbonate and sulfuric acid when 29 mL of sulfuric acid have been added?
An experiment was carried out measuring the boiling point and freezing point of an unknown organic liquid (Sample X) with varying levels of salt dissolved within it. The experiment was conducted in the following manner:
First, the experimenter measured the boiling point and freezing point of Sample X.
Next, a known quantity of salt was dissolved into the sample and then the boiling point and freezing points were measured again.
The results of the experiment are outlined in the table below:

What is the normal freezing point of Sample X?
An experiment was carried out measuring the boiling point and freezing point of an unknown organic liquid (Sample X) with varying levels of salt dissolved within it. The experiment was conducted in the following manner:
First, the experimenter measured the boiling point and freezing point of Sample X.
Next, a known quantity of salt was dissolved into the sample and then the boiling point and freezing points were measured again.
The results of the experiment are outlined in the table below:
What would we predict the boiling point of Sample X to be if the concentration of salt within it were 210 mg/L?
If a drug is taken orally, then the concentration of that drug in the blood will rise to a peak concentration. Immediately afterwards, the elimination phase begins and the concentration of the drug in the body will fall exponentially. Each drug has a half-life (i.e. the time required for the drug's concentration in the blood to fall to half of its original value). Once the elimination phase has initiated, it typically takes four half-lives until the drug has been entirely eliminated from the body.
If an individual is given multiple doses of a drug over time, then the blood concentration of the drug will rise and fall periodically. This creates a graph of drug’s concentration versus time that will resemble a wave. The rising peaks of the graph occur immediately after administration of a dose, whereas the falling valleys occur as the drug is being eliminated. The inter-dose interval, represented by the letter 
Experiment 1
A 125-milligram oral dose of a drug known as Cyclosporin A (CsA) was administered to an individual. The CsA blood concentration for this individual was then measured at various times over the next 24 hours. A graph of CsA concentration versus time was obtained.

Experiment 2
An individual was given multiple doses of CsA over a 60-hour period. The CsA blood concentration was monitored continuously. A graph of CsA concentration versus time was obtained.

Suppose drug administration had continued past 60 hours during Experiment 2. Based on the results of Experiment 2, what would be the most likely concentration of CsA at 66 hours (assume the drug continued to be administered in the same exact way)?