How to find synthesis of data in chemistry
Practice Questions
ACT Science Test › How to find synthesis of data in chemistry
A free energy reaction diagram shows the energy of a chemical reaction as it progresses from start to finish. In Example 1 below, the reactants (at point A) start with a certain energy. Energy is then applied to initiate the reaction (this is called activation energy) and the reaction progresses to point B. Lastly, energy is released in the reaction leading to point C. If the net change in free energy of a reaction is positive, the reaction is called a nonspontaneous reaction, meaning that it takes more energy to initiate it than the energy released. If the net change in free energy of a reaction is negative, it is called spontaneous, meaning that the energy released is more than the energy needed to initiate the reaction.
Example 1:
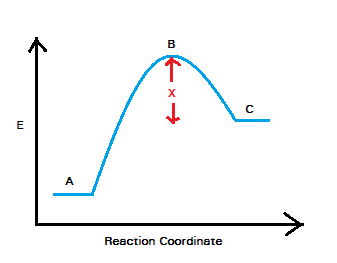
According to the information provided in the passage, how can we describe the activation energy needed to initiate the reaction in Example 1?
If a drug is taken orally, then the concentration of that drug in the blood will rise to a peak concentration. Immediately afterwards, the elimination phase begins and the concentration of the drug in the body will fall exponentially. Each drug has a half-life (i.e. the time required for the drug's concentration in the blood to fall to half of its original value). Once the elimination phase has initiated, it typically takes four half-lives until the drug has been entirely eliminated from the body.
If an individual is given multiple doses of a drug over time, then the blood concentration of the drug will rise and fall periodically. This creates a graph of drug’s concentration versus time that will resemble a wave. The rising peaks of the graph occur immediately after administration of a dose, whereas the falling valleys occur as the drug is being eliminated. The inter-dose interval, represented by the letter 
Experiment 1
A 125-milligram oral dose of a drug known as Cyclosporin A (CsA) was administered to an individual. The CsA blood concentration for this individual was then measured at various times over the next 24 hours. A graph of CsA concentration versus time was obtained.

Experiment 2
An individual was given multiple doses of CsA over a 60-hour period. The CsA blood concentration was monitored continuously. A graph of CsA concentration versus time was obtained.

If a drug’s concentration rises above a toxicity level at any point during administration, then unwanted side effects will occur. Suppose the toxicity level of CsA is as follows:

Based on the results of Experiment 2, did the individual receiving CsA experience unwanted side effects?
The Ideal Gas Law is as follows:


A class of students began studying the Ideal Gas Law and how the Pressure and the Volume relate to one another. They took 20 moles of a sample gas and kept the room at a temperature of 300 Kelvin. They then used different sized containers of the gas to limit and expand the volume. At each different volume, they measure the pressure of the gas on its container. The table they made from their results is seen in table 1.
| Volume of the container | Pressure Measured in Pascals |
|---|---|
| 1 cubic meter | 49,884 Pascals |
| 2 cubic meters | 24,942 Pascals |
| 3 cubic meters | 16,628 Pascals |
| 4 cubic meters | 12,471 Pascals |
| 5 cubic meters | 9,976.8 Pascals |
| 6 cubic meters | 8,314 Pascals |
| 7 cubic meters | 7,126.2 Pascals |
TABLE 1
And they graph their findings in Figure 1.
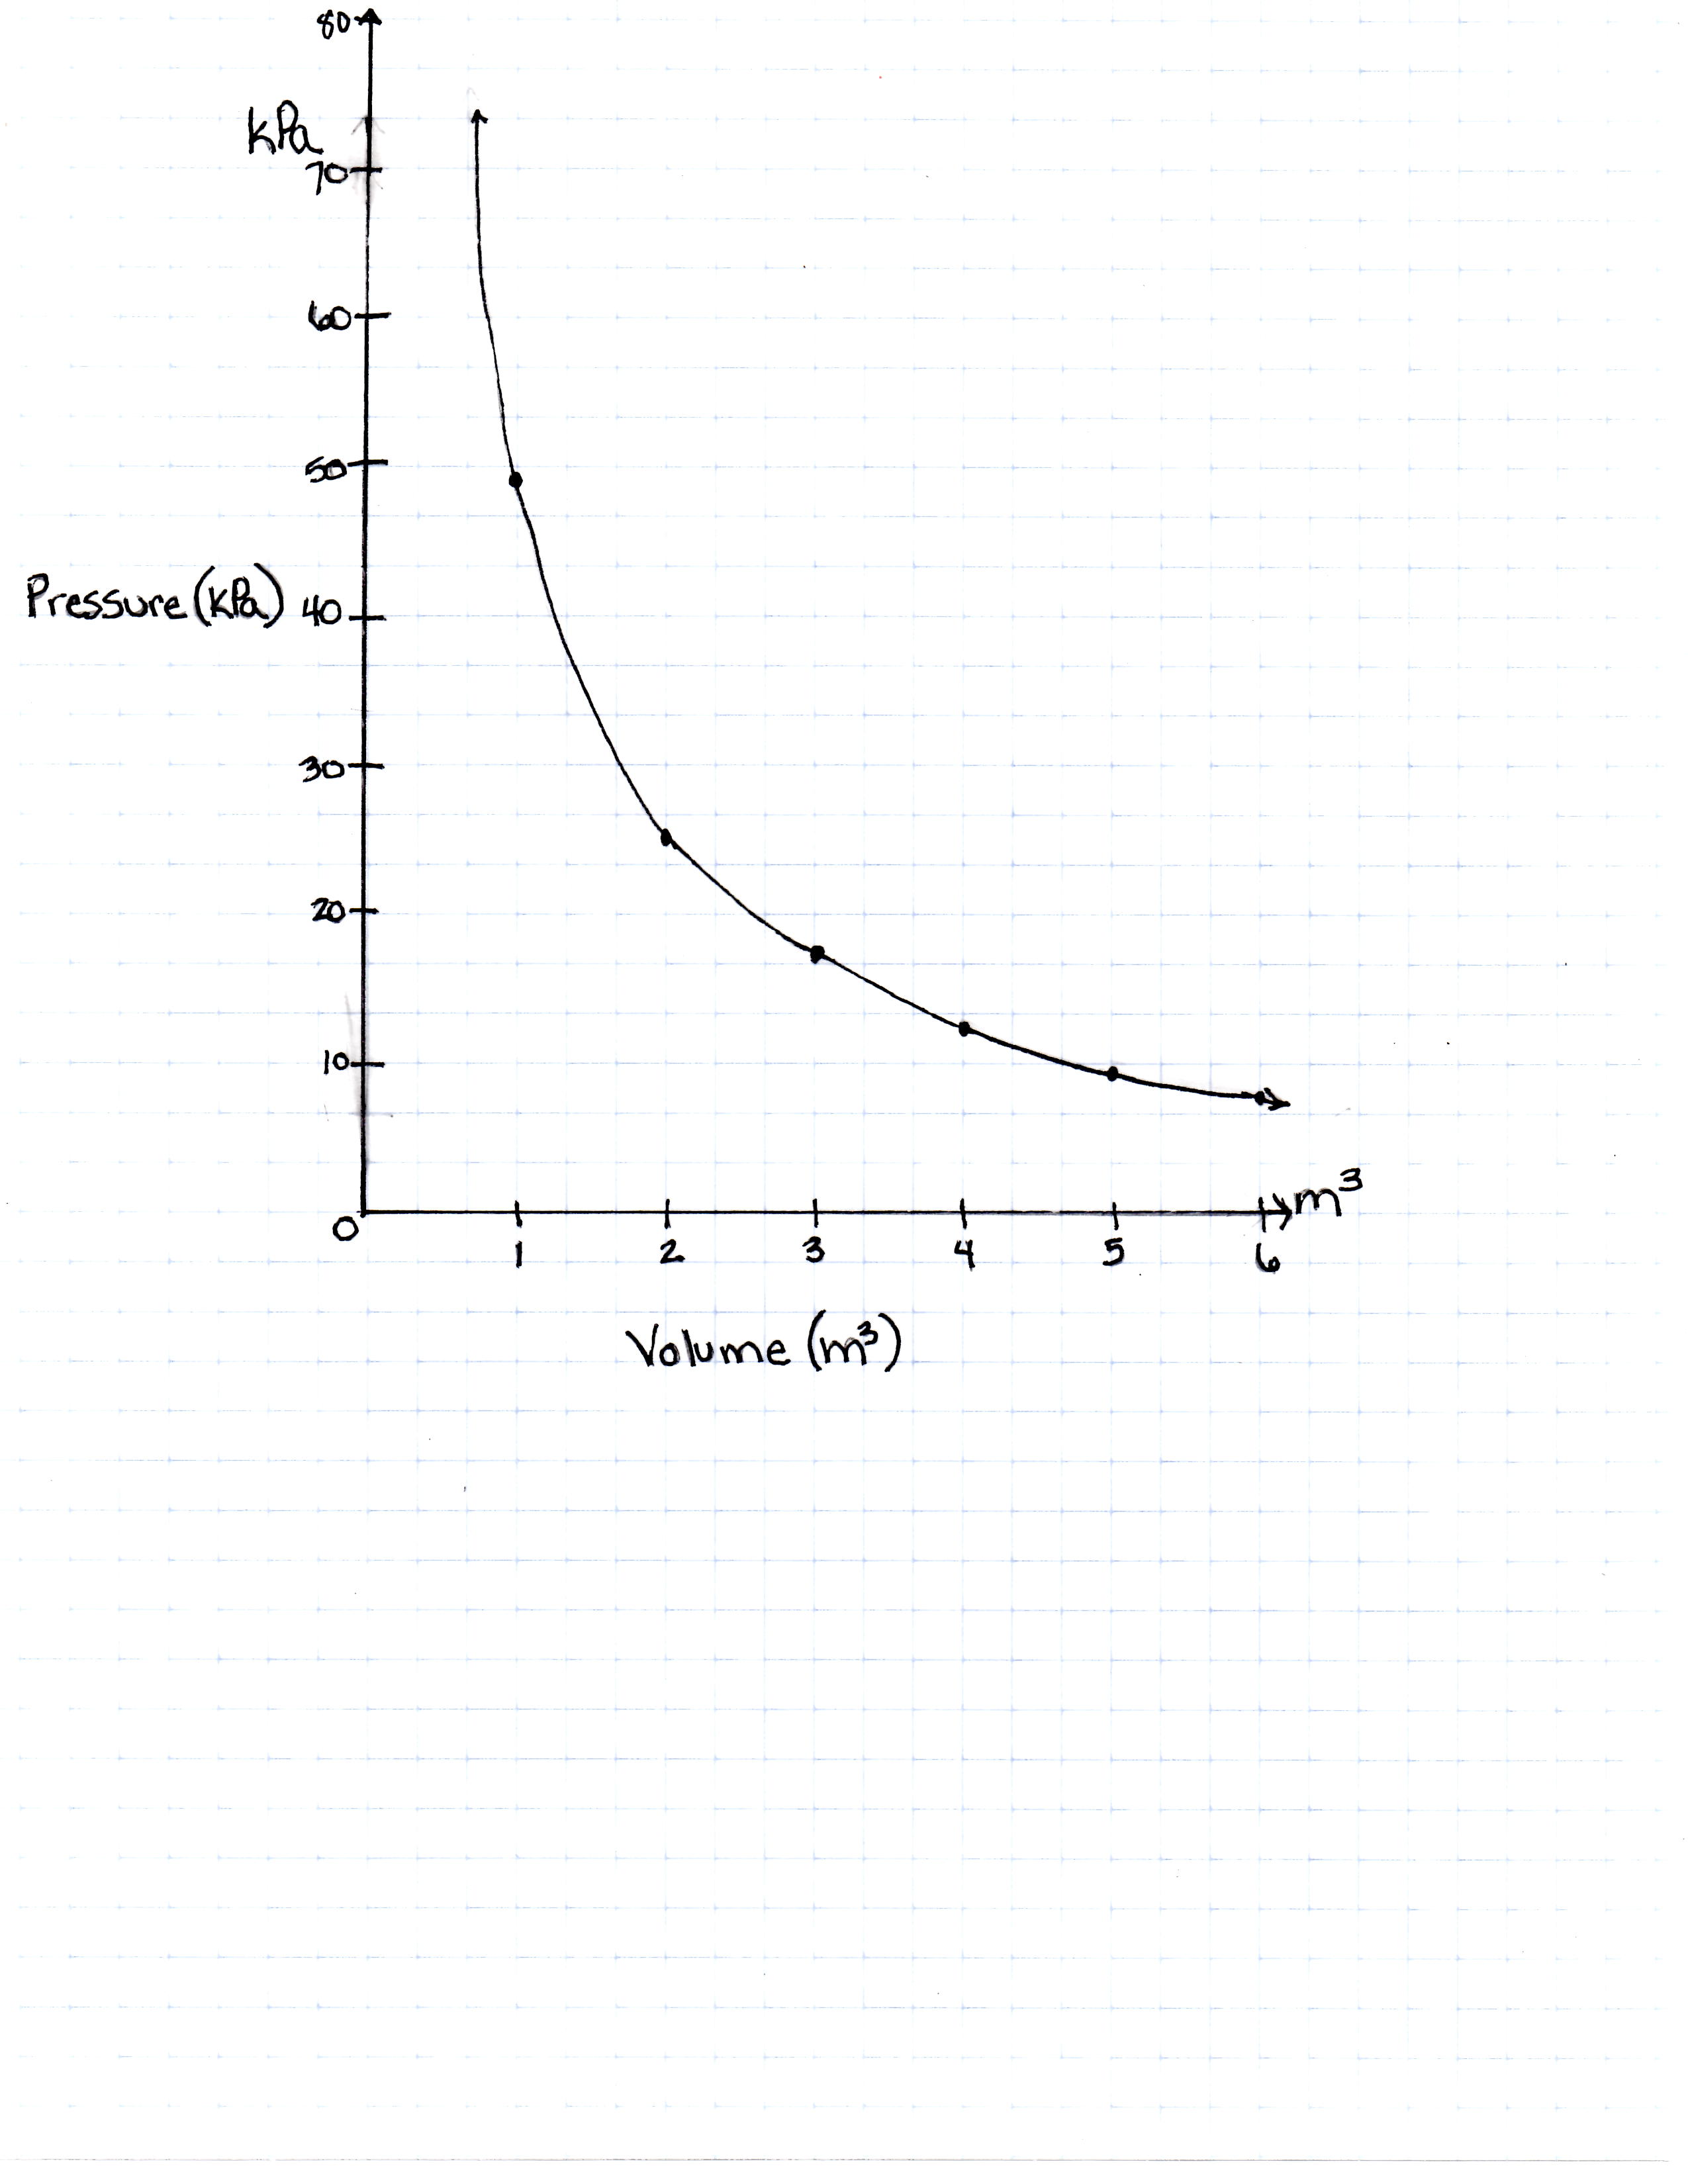
FIGURE 1
If the Kelvin temperature were to rise, what would happen to the pressure?
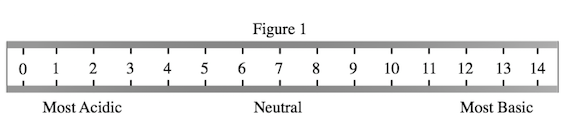
A student wished to study the acidity and basicity of various household ingredients and chemicals using her own, homemade pH indicator. A pH indicator is a substance that changes colors to indicate the acidity or basicity of a chemical solution. Acids can be defined as substances that donate hydrogen ions, or H+, while bases are substances that accept H+ ions. The strength of these acids and bases can be measured using the pH scale as shown in Figure 1.
Experiment 1:
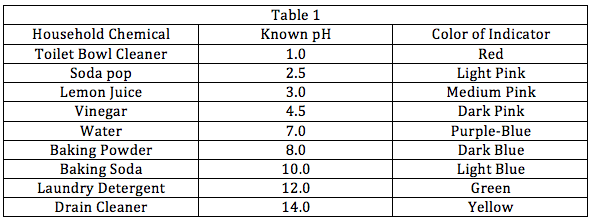
The student placed a leaf of red cabbage in a blender with one liter of water and blended until the cabbage had been liquefied. She then strained the purple mixture and bottled it. The student then added one drop of her homemade cabbage pH indicator to a variety of household chemicals listed in Table 1. She recorded the known pH of these chemicals as well as the color the indicator turned when added to these chemicals.
Experiment 2:
The student wanted to see how baking soda would react in the presence of other household chemicals. She combined baking soda in water separately with each of the other chemicals used in Experiment 1. Some combinations would create bubbling while some other combinations wouldn't. She recorded the results in Table 2 below.
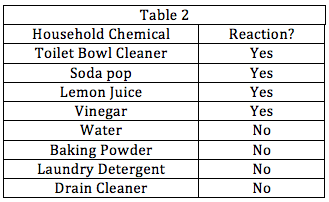
A new indicator, called Methyl Red, is also used to test the household chemicals from Experiments 1 and 2. It is found that the indicator turns red in the presence of toilet bowl cleaner, soda pop, or lemon juice; it turns orange in the presence of vinegar; it turns yellow in the presence of the rest of the chemicals. Which of the following pH ranges most likely contain the pH value at which Methyl Red has its color transition, or pH at which the indicator will stop being red and change to yellow?
The Ideal Gas Law is as follows:


A class of students began studying the Ideal Gas Law and how the Pressure and the Volume relate to one another. They took 20 moles of a sample gas and kept the room at a temperature of 300 Kelvin. They then used different sized containers of the gas to limit and expand the volume. At each different volume, they measure the pressure of the gas on its container. The table they made from their results is seen in table 1.
| Temperature in Kelvin | Pressure Measured in Pascals |
|---|---|
| 200 Kelvin | 16, 628 Pascals |
| 400 Kelvin | 33, 256 Pascals |
| 600 Kelvin | 49, 884 Pascals |
| 800 Kelvin | 66, 512 Pascals |
TABLE 1
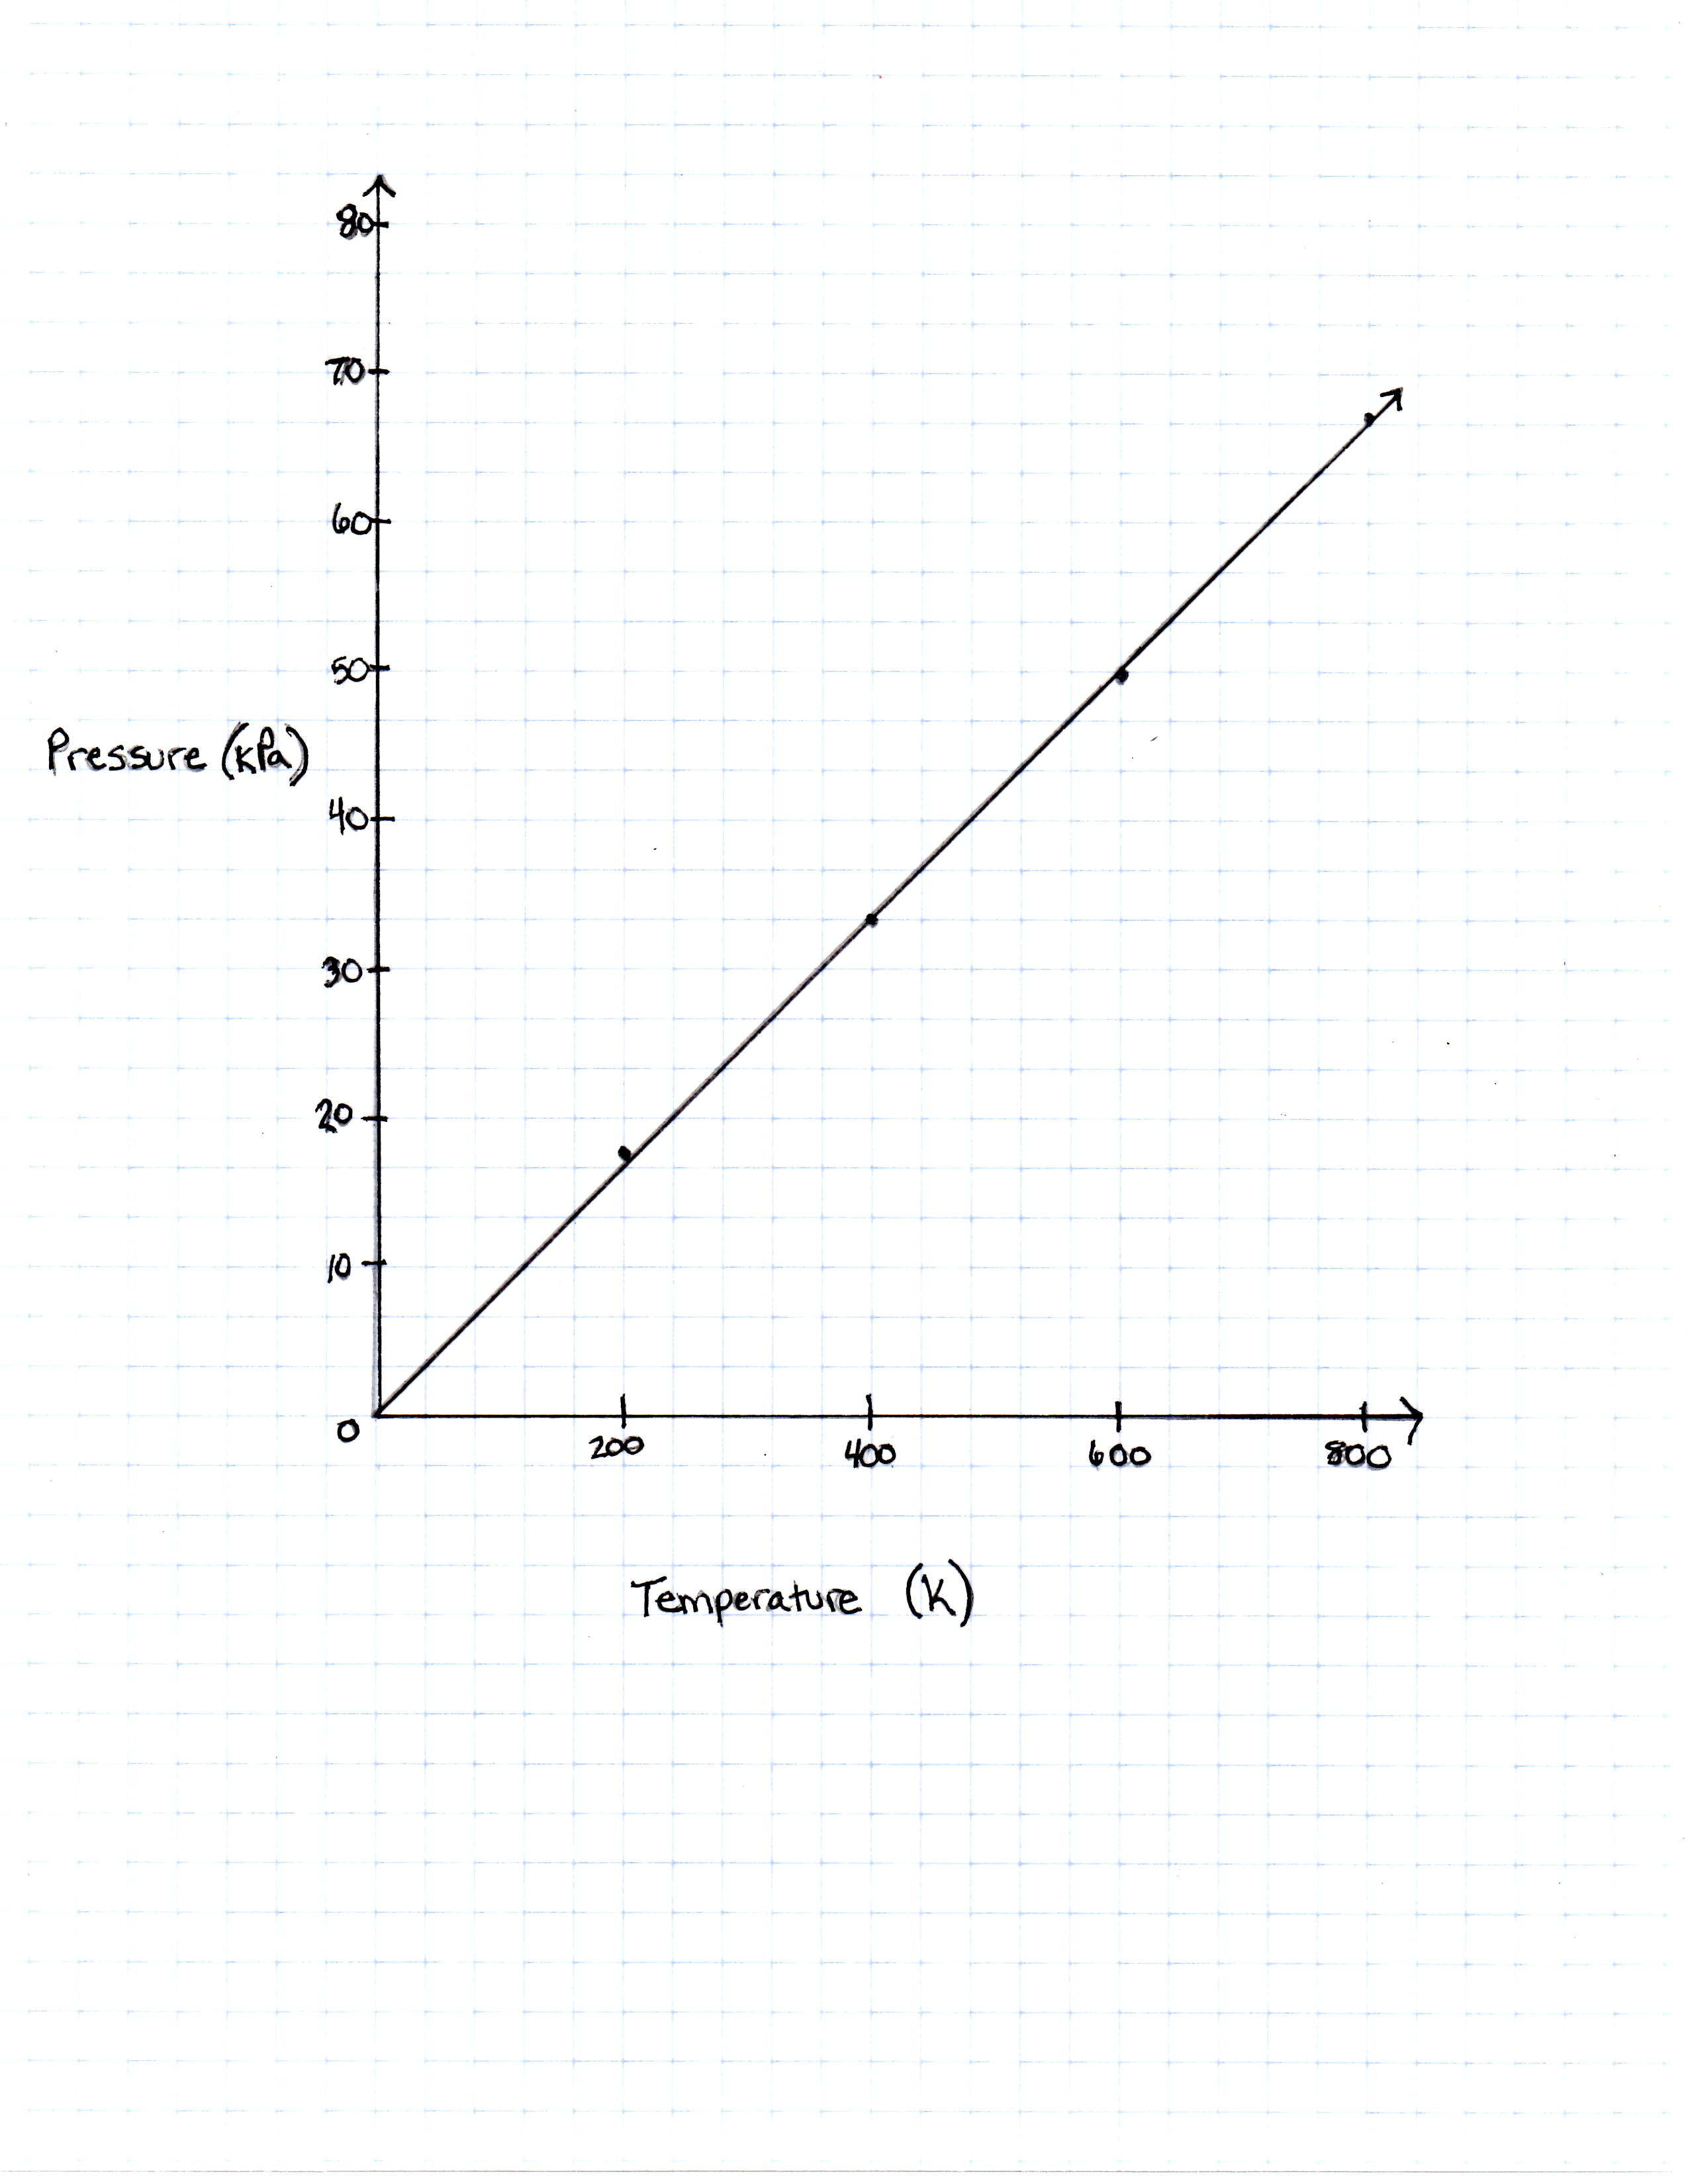
FIGURE 1
The graph the students made based on the data is seen in Figure 1.
Pressure is created by the movement of the gas molecules pushing against a container. 0 Kelvin is known as absolute 0, the temperature at which all molecule movement theoretically stops.
If the equation for converting Kelvin to degrees Fahrenheit is:
 + 32")
at what temperature Fahrenheit is the pressure

A student performed the following procedures to study various photosynthetic pigments (light-absorbing chemicals) in tree leaves and the wavelengths of light they absorb.
Experiment 1:
The student obtained samples of leaves from oaks, maples, ashes, sycamores, and poplars. Each leaf sample was ground separately with a mortar and pestle to release the pigments, and then each sample was suspended in water to make a colored solution of the pigment. The student then measured the absorption spectrum (a graph of how much light is absorbed by a pigment at varying wavelengths of light) of each solution in a device called a spectrophotometer. The setup of a spectrophotometer is shown below in Diagram 1.
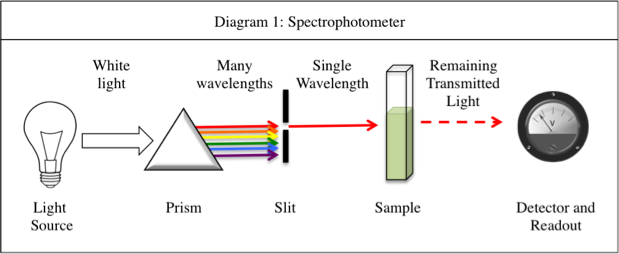
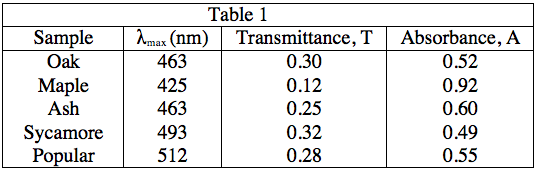
The light source emits white light, which is split into its various wavelengths by the prism. Next, a slit, which can be moved up or down to select a particular wavelength, is used to transmit just a single wavelength to the sample. The sample absorbs a fraction of this light that is characteristic to the pigment in the sample, and the rest is transmitted to the detector for a readout. Using the spectrophotometer, the student found the λmax (the wavelength of light in nanometers (nm) that the pigment absorbs most intensely, for each sample) and recorded the results in Table 1. Table 1 also shows the transmittance and absorbance values at λmax. Transmittance, T, is defined as the fraction of light, expressed as a decimal, which passes through the sample. Absorbance, A, is given by:
A = –log(T) or 10–A = T
Experiment 2:
A student is given a leaf from an unknown source. She crushes and extracts the pigment according to the procedure in Experiment 1. Measuring the absorbance spectrum in the spectrophotometer produces the following readout, shown in Diagram 2.
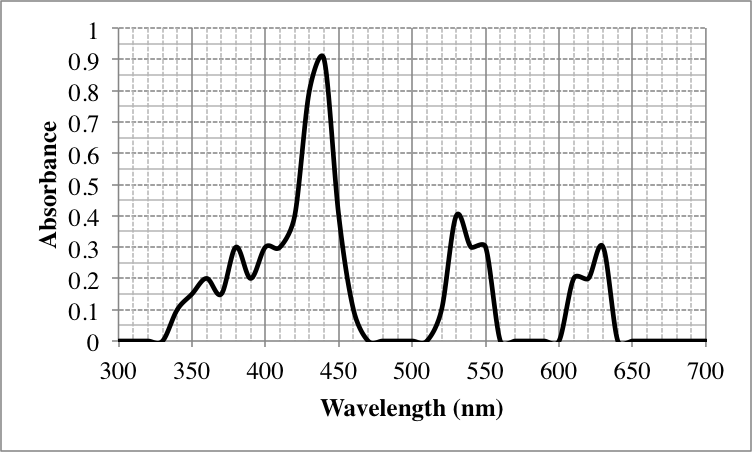
Diagram 2
A lumberjack wants to plant trees that make the most efficient use of sunlight in a shady area of her land. Which trees should she plant?
A brilliant but underpaid high school chemistry teacher, together with his former student, manufactures a chemical compound, which they sell for a large mark-up. Their set of reactions are given below:
(1) A + B + C + acid --> D
(2) D --> intermediate
(3) Intermediate --> E
(4) E + acid --> X
His student notes the following observations:
Observation 1) If a greater amount of B and C are used in the reaction, this yields no increased amount of product D.
Observation 2) At any given point, D, the intermediate, and E may co-exist in equal proportions. However, at higher temperatures, higher proportions of product E are noted.
Observation 3) The addition of a strong base can reverse reaction 4.
If reaction 4 is conducted in isolation, removing some of the product, X, will have which of the following effects?
The rate of a reversible chemical reaction depends on many factors, including concentrations of the reactants and products, temperature, and presence of enzymes called catalysts. In the forward reaction, two reactants combine to form one product. However, in a reverse reaction, the product is broken down into the two reactants.
In order for a forward reaction to occur, the reactants moving around in the test tube must physically interact with each other. The more often reactants interact with each other, the more produce is formed in the same amount of time. The speed at which reactants combine into products (the rate of the reaction) can be calculated by dividing the amount of a chemical produced in a reaction (often measured in moles) by the time it takes to produce that amount.
In order to determine the effects of reactant and product concentration, temperature, and presence of catalysts on the rate of a reaction, a scientist studied the following reaction:

The scientist varied the conditions of the experiment and measured the rate of the reaction. The results are outlined in Table 1. The units of concentration are moles per liter.
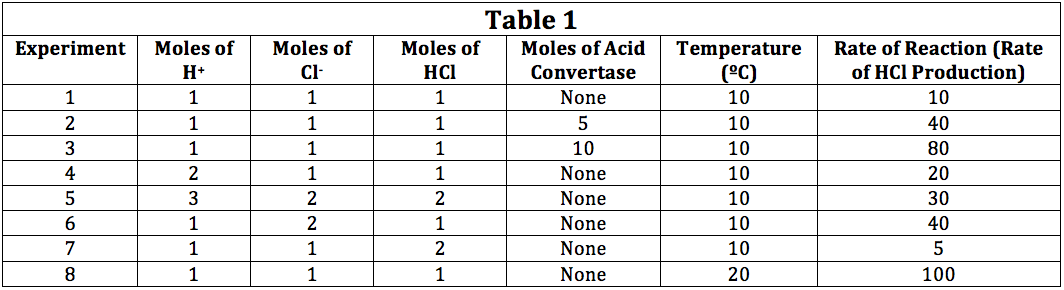
The effect of temperature on the rate of reaction is best demonstrated by comparing which two trials?
The rate of a reversible chemical reaction depends on many factors, including concentrations of the reactants and products, temperature, and presence of enzymes called catalysts. In the forward reaction, two reactants combine to form one product. However, in a reverse reaction, the product is broken down into the two reactants.
In order for a forward reaction to occur, the reactants moving around in the test tube must physically interact with each other. The more often reactants interact with each other, the more produce is formed in the same amount of time. The speed at which reactants combine into products (the rate of the reaction) can be calculated by dividing the amount of a chemical produced in a reaction (often measured in moles) by the time it takes to produce that amount.
In order to determine the effects of reactant and product concentration, temperature, and presence of catalysts on the rate of a reaction, a scientist studied the following reaction:

The scientist varied the conditions of the experiment and measured the rate of the reaction. The results are outlined in Table 1. The units of concentration are moles per liter.
In Experiment 8, if the moles of H+ were doubled, the expected rate of the reaction would be:
Chemists can model how solids, liquids, and gases behave at different temperatures and pressures with a graph called a phase diagram. When the pressure and temperature are simultaneously known, a scientist can predict whether the material will be in a specific state. The diagram is divided into sections depending on the phase and the lines between sections represent phase transitions occurring between two or more separate phases.
In general, solids of neatly stacked molecules exist when temperatures are low and pressures are intermediate. These values decrease the kinetic energy of the molecules enough to allow for attractive forces to begin the stacking process. Liquids, by contrast, are found at intermediate pressures and temperatures. The temperature is high enough to impart enough kinetic energy to prevent solid formation and the pressure is high enough to prevent the liquid from becoming a gas. Finally, a gas forms at low pressures and high temperatures. The high level of kinetic energy prevents molecules from associating with one another.
Materials can undergo processes called phase transitions, meaning they can transition from one phase to another. The transition from a solid to a liquid is called melting, while the reverse transition is called freezing. Vaporization occurs when a liquid becomes a gas, while condensation occurs when a gas becomes a liquid. Finally, in a process called sublimation, a solid can directly become a gas without passing through a liquid phase. Additionally, when a gas directly becomes a solid, this is known as deposition.
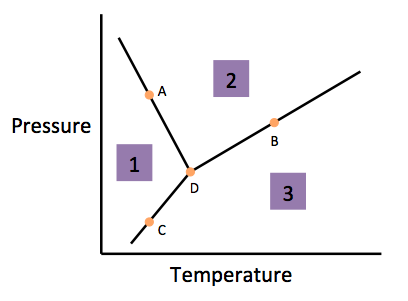
The process as a substance goes from its phase in area one to its new phase in area two is called __________.