Chemistry
Practice Questions
ACT Science Test › Chemistry
During digestion, the energy in food is converted to energy the body can use. Scientists use calorimetry experiments to measure the calories, or energy, provided by food when it is digested or burned.
The relationship used to find the heat transferred energy ")


In this experiment, food was burned over a Bunsen burner under a can of 200 ml of water. The temperature change of the water and mass change of the food can be used to determine the calories in four different food items.
Table 1 shows the values of the change of mass of the food items, the change in temperature of the water and the energy. Table 2 shows the energy to mass ratio of three of those food items.
Table 1
Roasted Peanut Peanut Cracker Cheese Puff
Water Temp. Initial 23.9 °C 33.2 °C 40.3 °C 53.9 °C
Water Temp. Final 30.0 °C 40.9 °C 55.9 °C 62.8 °C
Food Mass Initial 0.69 g 0.61 g 3.21 g 1.22 g
Food Mass Final 0.38 g 0.21 g 0.91 g 0.48 g
Energy 1.22 Cal 1.54 Cal 3.12 Cal 1.78 Cal
Table 2
Sample Energy to Mass Ratio (Cal/g)
1 1.36
2 3.93
3 2.40
According to information from Tables 1 and 2, order the samples' energy to mass ratios from least to greatest.
During digestion, the energy in food is converted to energy the body can use. Scientists use calorimetry experiments to measure the calories, or energy, provided by food when it is digested or burned.
The relationship used to find the heat transferred energy
In this experiment, food was burned over a Bunsen burner under a can of 200 ml of water. The temperature change of the water and mass change of the food can be used to determine the calories in four different food items.
Table 1 shows the values of the change of mass of the food items, the change in temperature of the water and the energy. Table 2 shows the energy to mass ratio of three of those food items.
Table 1
Roasted Peanut Peanut Cracker Cheese Puff
Water Temp. Initial 23.9 °C 33.2 °C 40.3 °C 53.9 °C
Water Temp. Final 30.0 °C 40.9 °C 55.9 °C 62.8 °C
Food Mass Initial 0.69 g 0.61 g 3.21 g 1.22 g
Food Mass Final 0.38 g 0.21 g 0.91 g 0.48 g
Energy 1.22 Cal 1.54 Cal 3.12 Cal 1.78 Cal
Table 2
Sample Energy to Mass Ratio (Cal/g)
1 1.36
2 3.93
3 2.40
According to information from Tables 1 and 2, order the samples' energy to mass ratios from least to greatest.
During digestion, the energy in food is converted to energy the body can use. Scientists use calorimetry experiments to measure the calories, or energy, provided by food when it is digested or burned.
The relationship used to find the heat transferred energy ")
In this experiment, food was burned over a Bunsen burner under a can of 200 ml of water. The temperature change of the water and mass change of the food can be used to determine the calories in four different food items.
Table 1 shows the values of the change of mass of the food items, the change in temperature of the water and the energy. Table 2 shows the energy to mass ratio of three of those food items.
Table 1
Roasted Peanut Peanut Cracker Cheese Puff
Water Temp. Initial 23.9 °C 33.2 °C 40.3 °C 53.9 °C
Water Temp. Final 30.0 °C 40.9 °C 55.9 °C 62.8 °C
Food Mass Initial 0.69 g 0.61 g 3.21 g 1.22 g
Food Mass Final 0.38 g 0.21 g 0.91 g 0.48 g
Energy 1.22 Cal 1.54 Cal 3.12 Cal 1.78 Cal
Table 2
Sample Energy to Mass Ratio (Cal/g)
1 1.36
2 3.93
3 2.40
Based on the results shown in Table 1 from the experiment, what is the relationship between the mass change of the food sample and the calories in the food?
During digestion, the energy in food is converted to energy the body can use. Scientists use calorimetry experiments to measure the calories, or energy, provided by food when it is digested or burned.
The relationship used to find the heat transferred energy
In this experiment, food was burned over a Bunsen burner under a can of 200 ml of water. The temperature change of the water and mass change of the food can be used to determine the calories in four different food items.
Table 1 shows the values of the change of mass of the food items, the change in temperature of the water and the energy. Table 2 shows the energy to mass ratio of three of those food items.
Table 1
Roasted Peanut Peanut Cracker Cheese Puff
Water Temp. Initial 23.9 °C 33.2 °C 40.3 °C 53.9 °C
Water Temp. Final 30.0 °C 40.9 °C 55.9 °C 62.8 °C
Food Mass Initial 0.69 g 0.61 g 3.21 g 1.22 g
Food Mass Final 0.38 g 0.21 g 0.91 g 0.48 g
Energy 1.22 Cal 1.54 Cal 3.12 Cal 1.78 Cal
Table 2
Sample Energy to Mass Ratio (Cal/g)
1 1.36
2 3.93
3 2.40
Based on the results shown in Table 1 from the experiment, what is the relationship between the mass change of the food sample and the calories in the food?
During digestion, the energy in food is converted to energy the body can use. Scientists use calorimetry experiments to measure the calories, or energy, provided by food when it is digested or burned.
The relationship used to find the heat transferred energy ")
In this experiment, food was burned over a Bunsen burner under a can of 200 ml of water. The temperature change of the water and mass change of the food can be used to determine the calories in four different food items.
Table 1 shows the values of the change of mass of the food items, the change in temperature of the water and the energy. Table 2 shows the energy to mass ratio of three of those food items.
Table 1
Roasted Peanut Peanut Cracker Cheese Puff
Water Temp. Initial 23.9 °C 33.2 °C 40.3 °C 53.9 °C
Water Temp. Final 30.0 °C 40.9 °C 55.9 °C 62.8 °C
Food Mass Initial 0.69 g 0.61 g 3.21 g 1.22 g
Food Mass Final 0.38 g 0.21 g 0.91 g 0.48 g
Energy 1.22 Cal 1.54 Cal 3.12 Cal 1.78 Cal
Table 2
Sample Energy to Mass Ratio (Cal/g)
1 1.36
2 3.93
3 2.40
Based on the information in Table 1, what variables must be measured in order to calculate the energy of the food samples?
During digestion, the energy in food is converted to energy the body can use. Scientists use calorimetry experiments to measure the calories, or energy, provided by food when it is digested or burned.
The relationship used to find the heat transferred energy
In this experiment, food was burned over a Bunsen burner under a can of 200 ml of water. The temperature change of the water and mass change of the food can be used to determine the calories in four different food items.
Table 1 shows the values of the change of mass of the food items, the change in temperature of the water and the energy. Table 2 shows the energy to mass ratio of three of those food items.
Table 1
Roasted Peanut Peanut Cracker Cheese Puff
Water Temp. Initial 23.9 °C 33.2 °C 40.3 °C 53.9 °C
Water Temp. Final 30.0 °C 40.9 °C 55.9 °C 62.8 °C
Food Mass Initial 0.69 g 0.61 g 3.21 g 1.22 g
Food Mass Final 0.38 g 0.21 g 0.91 g 0.48 g
Energy 1.22 Cal 1.54 Cal 3.12 Cal 1.78 Cal
Table 2
Sample Energy to Mass Ratio (Cal/g)
1 1.36
2 3.93
3 2.40
Based on the information in Table 1, what variables must be measured in order to calculate the energy of the food samples?
During digestion, the energy in food is converted to energy the body can use. Scientists use calorimetry experiments to measure the calories, or energy, provided by food when it is digested or burned.
The relationship used to find the heat transferred energy ")
In this experiment, food was burned over a Bunsen burner under a can of 200 ml of water. The temperature change of the water and mass change of the food can be used to determine the calories in four different food items.
Table 1 shows the values of the change of mass of the food items, the change in temperature of the water and the energy. Table 2 shows the energy to mass ratio of three of those food items.
Table 1
Roasted Peanut Peanut Cracker Cheese Puff
Water Temp. Initial 23.9 °C 33.2 °C 40.3 °C 53.9 °C
Water Temp. Final 30.0 °C 40.9 °C 55.9 °C 62.8 °C
Food Mass Initial 0.69 g 0.61 g 3.21 g 1.22 g
Food Mass Final 0.38 g 0.21 g 0.91 g 0.48 g
Energy 1.22 Cal 1.54 Cal 3.12 Cal 1.78 Cal
Table 2
Sample Energy to Mass Ratio (Cal/g)
1 1.36
2 3.93
3 2.40
The student performing the experiment concluded that eating an amount of crackers would provide an athlete with more energy than eating the same amount of any of the other food samples. Do the results in Tables 1 and 2 support this claim?
During digestion, the energy in food is converted to energy the body can use. Scientists use calorimetry experiments to measure the calories, or energy, provided by food when it is digested or burned.
The relationship used to find the heat transferred energy
In this experiment, food was burned over a Bunsen burner under a can of 200 ml of water. The temperature change of the water and mass change of the food can be used to determine the calories in four different food items.
Table 1 shows the values of the change of mass of the food items, the change in temperature of the water and the energy. Table 2 shows the energy to mass ratio of three of those food items.
Table 1
Roasted Peanut Peanut Cracker Cheese Puff
Water Temp. Initial 23.9 °C 33.2 °C 40.3 °C 53.9 °C
Water Temp. Final 30.0 °C 40.9 °C 55.9 °C 62.8 °C
Food Mass Initial 0.69 g 0.61 g 3.21 g 1.22 g
Food Mass Final 0.38 g 0.21 g 0.91 g 0.48 g
Energy 1.22 Cal 1.54 Cal 3.12 Cal 1.78 Cal
Table 2
Sample Energy to Mass Ratio (Cal/g)
1 1.36
2 3.93
3 2.40
The student performing the experiment concluded that eating an amount of crackers would provide an athlete with more energy than eating the same amount of any of the other food samples. Do the results in Tables 1 and 2 support this claim?
Chemists can model how solids, liquids, and gases behave at different temperatures and pressures with a graph called a phase diagram. When the pressure and temperature are simultaneously known, a scientist can predict whether the material will be in a specific state. The diagram is divided into sections depending on the phase and the lines between sections represent phase transitions occurring between two or more separate phases.
In general, solids of neatly stacked molecules exist when temperatures are low and pressures are intermediate. These values decrease the kinetic energy of the molecules enough to allow for attractive forces to begin the stacking process. Liquids, by contrast, are found at intermediate pressures and temperatures. The temperature is high enough to impart enough kinetic energy to prevent solid formation and the pressure is high enough to prevent the liquid from becoming a gas. Finally, a gas forms at low pressures and high temperatures. The high level of kinetic energy prevents molecules from associating with one another.
Materials can undergo processes called phase transitions, meaning they can transition from one phase to another. The transition from a solid to a liquid is called melting, while the reverse transition is called freezing. Vaporization occurs when a liquid becomes a gas, while condensation occurs when a gas becomes a liquid. Finally, in a process called sublimation, a solid can directly become a gas without passing through a liquid phase. Additionally, when a gas directly becomes a solid, this is known as deposition.
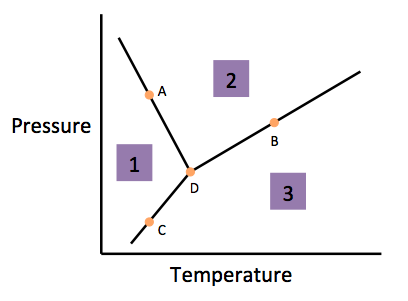
According to the figure, the material represented by Area 1 is in what phase?

The rate of a reaction is defined as the rate at which the products of a reaction are produced. A researcher wants to investigate the rate of reaction of the combustion of theoretical compound 

The results of the experiment are shown in the table below. The brackets (\[\]) indicate concentration measured in mol/L.

According to the data, what is the apparent relationship between oxygen concentration and the rate of the reaction?