Graphing an Inequality with a Number Line
Practice Questions
ACT Math › Graphing an Inequality with a Number Line
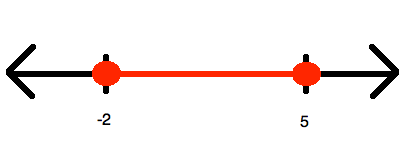
Which of the following inequalities is represented by the number line shown above?
Which of the following inequalities is represented by the number line shown above?

Which of the following is a graph for the values of 
Which of the following is a graph for the values of

Which of the following is a graph for the values of 
Which of the following is a graph for the values of
On a real number line, x1 = -4 and x2 = 14. What is the distance between these two points?
On a real number line, x1 = -4 and x2 = 14. What is the distance between these two points?