Data - 6th Grade Math
Card 0 of 2
A flower shop counted the number of flowers sold during a  month period. The distribution of this data is shown in the histogram provided. In which month were the least amount of flowers sold?
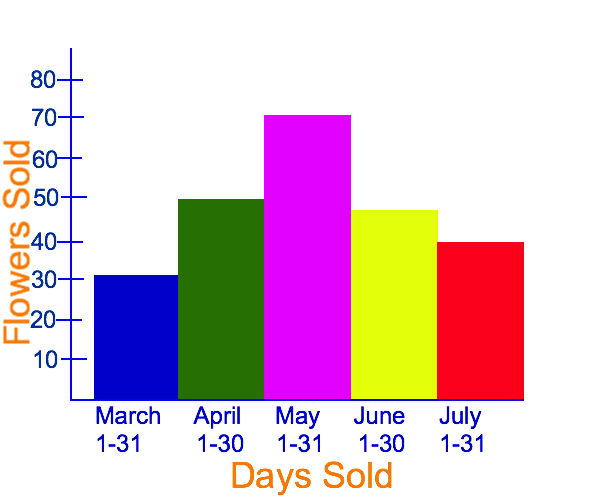
A flower shop counted the number of flowers sold during a
To answer this question, we can look at our graph and see how far each bar in the histogram raises:

We are looking for the shortest bar because we want to know during which month the least amount of flowers were sold. We can see that in March only  flowers were sold, which is the least for the period that was observed.
To answer this question, we can look at our graph and see how far each bar in the histogram raises:
We are looking for the shortest bar because we want to know during which month the least amount of flowers were sold. We can see that in March only
Compare your answer with the correct one above
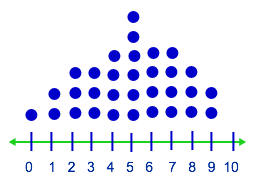
Mrs. Frame's class counted the number pencils that each student had in his/her desk. The distribution of this data is show in the dot plot provided. What is the most number of pencils that her students found?
Mrs. Frame's class counted the number pencils that each student had in his/her desk. The distribution of this data is show in the dot plot provided. What is the most number of pencils that her students found?
The dot plot is on a number line that is numbered from  .
.  is the highest number on the number line, but there are no dots above that number, which means no one found
  pencils in their desk.
  is the next highest number, and there are two dots over the number on the number line; thus, the correct answer is
The dot plot is on a number line that is numbered from
Compare your answer with the correct one above