Climates Around the World - 3rd Grade Science
Card 0 of 20
How would you describe the temperature in an arctic climate (Nuuk, Greenland) compared to a tropical climate (Nosy Be, Madagascar)?


How would you describe the temperature in an arctic climate (Nuuk, Greenland) compared to a tropical climate (Nosy Be, Madagascar)?
Using data tables or graphs are an easy way to compare the climates of two different regions visually. An arctic environment is freezing, and on the y-axis, the highest average temperature is less than 50oF. When reviewing the graph for Madagascar, which is in a tropical climate, the temperature does not fall below 80oF, which is a big difference. Using this information, one can conclude that an arctic environment has much lower temperatures on average than a tropical climate.
Using data tables or graphs are an easy way to compare the climates of two different regions visually. An arctic environment is freezing, and on the y-axis, the highest average temperature is less than 50oF. When reviewing the graph for Madagascar, which is in a tropical climate, the temperature does not fall below 80oF, which is a big difference. Using this information, one can conclude that an arctic environment has much lower temperatures on average than a tropical climate.
Compare your answer with the correct one above
How would you describe the temperature in a tropical climate (Nosy Be, Madagascar) compared to a temperate climate (Omaha, Nebraska)?

How would you describe the temperature in a tropical climate (Nosy Be, Madagascar) compared to a temperate climate (Omaha, Nebraska)?
A tropical and temperate climate are very different from each other. The tropical climate is consistent, and temperatures only range from around 83oF t0 90oF, whereas in the temperate zone, there is a more significant fluctuation of temperatures from about 45oF to nearly 90oF. A tropical climate has higher temperatures than a temperate zone, and the temperatures do not vary as greatly.
A tropical and temperate climate are very different from each other. The tropical climate is consistent, and temperatures only range from around 83oF t0 90oF, whereas in the temperate zone, there is a more significant fluctuation of temperatures from about 45oF to nearly 90oF. A tropical climate has higher temperatures than a temperate zone, and the temperatures do not vary as greatly.
Compare your answer with the correct one above
Which answer choice is the best description of the climate in a temperate zone based on the graphs provided?

Which answer choice is the best description of the climate in a temperate zone based on the graphs provided?
Temperate zones are known for their varying temperatures and amounts of precipitation. There are four distinct seasons, and this can be noticed on the graphs. The temperatures increase and decrease throughout the year, with summer being the warmest and winter is the coldest. The amount of rainfall is at its peak during the summer months and falls in the winter.
Temperate zones are known for their varying temperatures and amounts of precipitation. There are four distinct seasons, and this can be noticed on the graphs. The temperatures increase and decrease throughout the year, with summer being the warmest and winter is the coldest. The amount of rainfall is at its peak during the summer months and falls in the winter.
Compare your answer with the correct one above
Which answer choice is the best description of the climate in a tropical zone based on the graphs provided?

Which answer choice is the best description of the climate in a tropical zone based on the graphs provided?
Madagascar is in a tropical climate. It is warm all year and rainy during the hottest months, which is summer. Summer in Madagascar falls between December and March, and temperatures hover around 88oF with up to 18 inches of rain in one month. The temperatures decrease to the lower 80s in the winter months, and the rainfall drops to less than an inch.
Madagascar is in a tropical climate. It is warm all year and rainy during the hottest months, which is summer. Summer in Madagascar falls between December and March, and temperatures hover around 88oF with up to 18 inches of rain in one month. The temperatures decrease to the lower 80s in the winter months, and the rainfall drops to less than an inch.
Compare your answer with the correct one above
What type of characteristics would be included in a description of the climate in a region?
What type of characteristics would be included in a description of the climate in a region?
Many characteristics can describe the climate of a region. These characteristics can be measured over many years to identify the different patterns within the data to make predictions about future weather conditions. A few of the particular weather condition measurements that may be collected are temperature, humidity, wind speed, and air pressure.
Many characteristics can describe the climate of a region. These characteristics can be measured over many years to identify the different patterns within the data to make predictions about future weather conditions. A few of the particular weather condition measurements that may be collected are temperature, humidity, wind speed, and air pressure.
Compare your answer with the correct one above
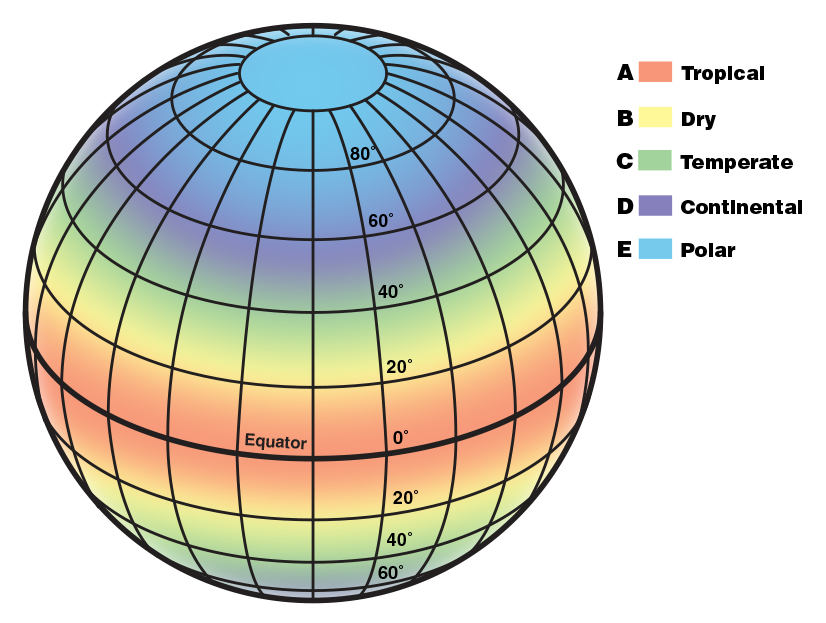
The National Oceanic and Atmospheric Administration describes the five main types of climates. They are:
A: Tropical. In this hot and humid zone, the average temperatures are higher than 64°F (18°C) year-round, and there are more than 59 inches of precipitation each year.
B: Dry. These climate zones are so dry because moisture is rapidly evaporated from the air, and there is very little precipitation.
C: Temperate. In this zone, there are typically warm and humid summers with thunderstorms and mild winters.
D. Continental. These regions have warm to cool summers and very cold winters. In the winter, this zone can experience snowstorms, strong winds, and very cold temperatures—sometimes falling below -22°F (-30°C)!
E: Polar. In the polar climate zones, it’s extremely cold. Even in summer, the temperatures here never go higher than 50°F (10°C)!

Which climate zone is NOT found in the United States?
The National Oceanic and Atmospheric Administration describes the five main types of climates. They are:
A: Tropical. In this hot and humid zone, the average temperatures are higher than 64°F (18°C) year-round, and there are more than 59 inches of precipitation each year.
B: Dry. These climate zones are so dry because moisture is rapidly evaporated from the air, and there is very little precipitation.
C: Temperate. In this zone, there are typically warm and humid summers with thunderstorms and mild winters.
D. Continental. These regions have warm to cool summers and very cold winters. In the winter, this zone can experience snowstorms, strong winds, and very cold temperatures—sometimes falling below -22°F (-30°C)!
E: Polar. In the polar climate zones, it’s extremely cold. Even in summer, the temperatures here never go higher than 50°F (10°C)!
Which climate zone is NOT found in the United States?
The climate zone NOT found in the United States is the polar zone. The polar climates zones are freezing and harsh places to live. The United States is a vast landmass and covers a good church of the Earth, leading to four of the five climate zones represented.
The climate zone NOT found in the United States is the polar zone. The polar climates zones are freezing and harsh places to live. The United States is a vast landmass and covers a good church of the Earth, leading to four of the five climate zones represented.
Compare your answer with the correct one above
The National Oceanic and Atmospheric Administration describes the five main types of climates. They are:
A: Tropical. In this hot and humid zone, the average temperatures are higher than 64°F (18°C) year-round, and there are more than 59 inches of precipitation each year.
B: Dry. These climate zones are so dry because moisture is rapidly evaporated from the air, and there is very little precipitation.
C: Temperate. In this zone, there are typically warm and humid summers with thunderstorms and mild winters.
D. Continental. These regions have warm to cool summers and very cold winters. In the winter, this zone can experience snowstorms, strong winds, and very cold temperatures—sometimes falling below -22°F (-30°C)!
E: Polar. In the polar climate zones, it’s extremely cold. Even in summer, the temperatures here never go higher than 50°F (10°C)!

How would the climate of MOST of Africa be described?
Source: https://scijinks.gov/climate-zones/ & http://www.webquest.hawaii.edu/kahihi/sciencedictionary/C/climatezone.php
The National Oceanic and Atmospheric Administration describes the five main types of climates. They are:
A: Tropical. In this hot and humid zone, the average temperatures are higher than 64°F (18°C) year-round, and there are more than 59 inches of precipitation each year.
B: Dry. These climate zones are so dry because moisture is rapidly evaporated from the air, and there is very little precipitation.
C: Temperate. In this zone, there are typically warm and humid summers with thunderstorms and mild winters.
D. Continental. These regions have warm to cool summers and very cold winters. In the winter, this zone can experience snowstorms, strong winds, and very cold temperatures—sometimes falling below -22°F (-30°C)!
E: Polar. In the polar climate zones, it’s extremely cold. Even in summer, the temperatures here never go higher than 50°F (10°C)!
How would the climate of MOST of Africa be described?
Source: https://scijinks.gov/climate-zones/ & http://www.webquest.hawaii.edu/kahihi/sciencedictionary/C/climatezone.php
This map of the climate zones breaks them down across the map by region. Africa falls into two different climate zones but is mostly tropical. The weather in tropical climate zones is very hot, there is very high humidity, and precipitation is frequent. This map helps readers to see how the world is broken up by climate zones.
This map of the climate zones breaks them down across the map by region. Africa falls into two different climate zones but is mostly tropical. The weather in tropical climate zones is very hot, there is very high humidity, and precipitation is frequent. This map helps readers to see how the world is broken up by climate zones.
Compare your answer with the correct one above
The National Oceanic and Atmospheric Administration describes the five main types of climates. They are:
A: Tropical. In this hot and humid zone, the average temperatures are higher than 64°F (18°C) year-round, and there are more than 59 inches of precipitation each year.
B: Dry. These climate zones are so dry because moisture is rapidly evaporated from the air, and there is very little precipitation.
C: Temperate. In this zone, there are typically warm and humid summers with thunderstorms and mild winters.
D. Continental. These regions have warm to cool summers and very cold winters. In the winter, this zone can experience snowstorms, strong winds, and very cold temperatures—sometimes falling below -22°F (-30°C)!
E: Polar. In the polar climate zones, it’s extremely cold. Even in summer, the temperatures here never go higher than 50°F (10°C)!
In what climate zone can Antarctica be found?
Source: https://scijinks.gov/climate-zones/ & http://www.webquest.hawaii.edu/kahihi/sciencedictionary/C/climatezone.php
Antarctica can be described as having a polar climate. It is found in the polar climate zone. Antarctica is a harsh, desolate place due to its frigid temperatures and unpredictable weather. There are no shrubs or trees on Antarctica, and only two types of flowering plants can survive the conditions.
Antarctica can be described as having a polar climate. It is found in the polar climate zone. Antarctica is a harsh, desolate place due to its frigid temperatures and unpredictable weather. There are no shrubs or trees on Antarctica, and only two types of flowering plants can survive the conditions.
Compare your answer with the correct one above
The National Oceanic and Atmospheric Administration describes the five main types of climates. They are:
A: Tropical. In this hot and humid zone, the average temperatures are higher than 64°F (18°C) year-round, and there are more than 59 inches of precipitation each year.
B: Dry. These climate zones are so dry because moisture is rapidly evaporated from the air, and there is very little precipitation.
C: Temperate. In this zone, there are typically warm and humid summers with thunderstorms and mild winters.
D. Continental. These regions have warm to cool summers and very cold winters. In the winter, this zone can experience snowstorms, strong winds, and very cold temperatures—sometimes falling below -22°F (-30°C)!
E: Polar. In the polar climate zones, it’s extremely cold. Even in summer, the temperatures here never go higher than 50°F (10°C)!
The United States is primarily in the temperate zone, excluding Alaska and Florida, which are in which zones?
Source: https://scijinks.gov/climate-zones/ & http://www.webquest.hawaii.edu/kahihi/sciencedictionary/C/climatezone.php
The majority of the United States is found in the temperate climate zone. Alaska is located in the polar region, and Florida is in a tropical area. Florida is humid, warm, and receives a lot of rainfall because it is closer to the equator than other parts of the United States. Alaska is located far to the North and closer to the North Pole than other parts of the United States.
The majority of the United States is found in the temperate climate zone. Alaska is located in the polar region, and Florida is in a tropical area. Florida is humid, warm, and receives a lot of rainfall because it is closer to the equator than other parts of the United States. Alaska is located far to the North and closer to the North Pole than other parts of the United States.
Compare your answer with the correct one above
The National Oceanic and Atmospheric Administration describes the five main types of climates. They are:
A: Tropical. In this hot and humid zone, the average temperatures are higher than 64°F (18°C) year-round, and there are more than 59 inches of precipitation each year.
B: Dry. These climate zones are so dry because moisture is rapidly evaporated from the air, and there is very little precipitation.
C: Temperate. In this zone, there are typically warm and humid summers with thunderstorms and mild winters.
D. Continental. These regions have warm to cool summers and very cold winters. In the winter, this zone can experience snowstorms, strong winds, and very cold temperatures—sometimes falling below -22°F (-30°C)!
E: Polar. In the polar climate zones, it’s extremely cold. Even in summer, the temperatures here never go higher than 50°F (10°C)!
What region of the United States would be the most likely to feature deserts?
Deserts would be located in a place with little rainfall, high temperatures, and that receives a lot of sunlight. Deserts would be found in the dry zone in the Southwest. Places like Nevada, Utah, Arizona, and Southern California have the perfect conditions for deserts and their inhabitants.
Deserts would be located in a place with little rainfall, high temperatures, and that receives a lot of sunlight. Deserts would be found in the dry zone in the Southwest. Places like Nevada, Utah, Arizona, and Southern California have the perfect conditions for deserts and their inhabitants.
Compare your answer with the correct one above
What does the term climate mean? Example: Due to the climate in the Northeast United States, residents can expect snow in January.
What does the term climate mean? Example: Due to the climate in the Northeast United States, residents can expect snow in January.
Weather and climate are two different terms but often confused. Climate refers to the weather conditions that are occurring in a specific area over a long time. The conditions have been studied every January for many years, and it is always snowy. Scientists and meteorologists can predict that the upcoming Januarys will be snowy based on this information.
Weather and climate are two different terms but often confused. Climate refers to the weather conditions that are occurring in a specific area over a long time. The conditions have been studied every January for many years, and it is always snowy. Scientists and meteorologists can predict that the upcoming Januarys will be snowy based on this information.
Compare your answer with the correct one above
Jackie has a homework assignment to obtain and combine information about world climates. She was assigned Phoenix, Arizona and Portland, Oregon as the climates to compare.
Which steps should Jackie take to obtain and combine information to compare the two climates?
Jackie has a homework assignment to obtain and combine information about world climates. She was assigned Phoenix, Arizona and Portland, Oregon as the climates to compare.
Which steps should Jackie take to obtain and combine information to compare the two climates?
The best steps that Jackie should take to complete this assignment would first be to research each city online in detail and record the information about the climate. Her information needs to be from a credible source and cannot be something she makes up. After the collects, the information, an excellent way to combine it would be through a data table or chart. This is an excellent visual way to see the data. Finally, Jackie can compare and contrast the two cities and determine any similarities or differences between their climates.
The best steps that Jackie should take to complete this assignment would first be to research each city online in detail and record the information about the climate. Her information needs to be from a credible source and cannot be something she makes up. After the collects, the information, an excellent way to combine it would be through a data table or chart. This is an excellent visual way to see the data. Finally, Jackie can compare and contrast the two cities and determine any similarities or differences between their climates.
Compare your answer with the correct one above
How could these two graphs about the precipitation and average temperatures be used to obtain information about climates?


How could these two graphs about the precipitation and average temperatures be used to obtain information about climates?
Obtaining and combining information about weather conditions is a way to gather information about the climate of different parts of the world. These graphs can be used to look for patterns. There may be connections between different months' temperature and precipitation, or there may be patterns within the months that can be used for predicting future weather. These graphs give valuable information that can be used for tracking, monitoring, and comparing.
Obtaining and combining information about weather conditions is a way to gather information about the climate of different parts of the world. These graphs can be used to look for patterns. There may be connections between different months' temperature and precipitation, or there may be patterns within the months that can be used for predicting future weather. These graphs give valuable information that can be used for tracking, monitoring, and comparing.
Compare your answer with the correct one above
Scientists record patterns of the weather across different times and places to make predictions about what kind of weather might happen next.
Scientists record patterns of the weather across different times and places to make predictions about what kind of weather might happen next.
This statement is true. Weather patterns are recorded and analyzed for trends and predictions. If scientists record information in a place over many years, they can find similarities or differences in the data that will help them predict what the weather will be like in that area for years to come. People rely on climate records to draw conclusions about the weather in an area.
This statement is true. Weather patterns are recorded and analyzed for trends and predictions. If scientists record information in a place over many years, they can find similarities or differences in the data that will help them predict what the weather will be like in that area for years to come. People rely on climate records to draw conclusions about the weather in an area.
Compare your answer with the correct one above
What conclusion can be made about the average temperature in Tampa, Florida, since the 1940s based on the graph provided?

What conclusion can be made about the average temperature in Tampa, Florida, since the 1940s based on the graph provided?
This graph is an excellent example of how obtaining data about weather conditions can help to provide information about the climate. The data is showing an increase in temperatures overtime in Tampa, Florida. Due to this trend, scientists can guess that the temperature will continue to increase over the upcoming decades as well. Using information obtained about weather or climate conditions can help with predictions about future patterns.
This graph is an excellent example of how obtaining data about weather conditions can help to provide information about the climate. The data is showing an increase in temperatures overtime in Tampa, Florida. Due to this trend, scientists can guess that the temperature will continue to increase over the upcoming decades as well. Using information obtained about weather or climate conditions can help with predictions about future patterns.
Compare your answer with the correct one above
The graph below shows the average temperature in Tampa, Florida, by decade since the 1940s. Which prediction about the temperatures in the 2020s is supported by the data?
The graph below shows the average temperature in Tampa, Florida, by decade since the 1940s. Which prediction about the temperatures in the 2020s is supported by the data?
This graph shows an increase in the average temperature from the 1940s until the 2010s. There are some decades where the temperature did drop lower, but overall there is an increase. The temperatures will likely continue their upwards descent, and it will be warmer in the 2020s. Graphs such as this one are an excellent tool for visually sharing complex data.
This graph shows an increase in the average temperature from the 1940s until the 2010s. There are some decades where the temperature did drop lower, but overall there is an increase. The temperatures will likely continue their upwards descent, and it will be warmer in the 2020s. Graphs such as this one are an excellent tool for visually sharing complex data.
Compare your answer with the correct one above
Justin is planning a vacation from his hometown of Los Angelos, California, to Greenland to visit the beautiful scenery. It will be winter in Greenland when he is there, so he has to figure out what to pack and wear. What is the best way for him to obtain this information?
Justin is planning a vacation from his hometown of Los Angelos, California, to Greenland to visit the beautiful scenery. It will be winter in Greenland when he is there, so he has to figure out what to pack and wear. What is the best way for him to obtain this information?
For Justin's trip, he needs to know what the weather will be like during the winter in Greenland. If he looks at the current weather conditions and it is not immediately before his trip, he is likely to pack for the wrong season. Justin should not let his social media followers pick his outfits because they are probably unfamiliar with the climate of Greenland and would base opinions on appearance rather than the weather. Justin should look up what the climate is like during the winter in Greenland and get an idea of the average temperatures and precipitation rates. This would give him a picture of what to expect during the trip.
For Justin's trip, he needs to know what the weather will be like during the winter in Greenland. If he looks at the current weather conditions and it is not immediately before his trip, he is likely to pack for the wrong season. Justin should not let his social media followers pick his outfits because they are probably unfamiliar with the climate of Greenland and would base opinions on appearance rather than the weather. Justin should look up what the climate is like during the winter in Greenland and get an idea of the average temperatures and precipitation rates. This would give him a picture of what to expect during the trip.
Compare your answer with the correct one above
How could these two graphs about the precipitation and average temperatures in Tampa, Florida, be combined into one report?
How could these two graphs about the precipitation and average temperatures in Tampa, Florida, be combined into one report?
Obtaining and combining information about weather conditions is a way to gather information about the climate of different parts of the world. These graphs can be used to look for patterns. There may be connections between different months' temperature and precipitation, or there may be patterns within the months that can be used for predicting future weather. In Tampa, Florida, during the summer months, temperatures reach more than 75o F, and there are often more than six inches of rain on average each month is the correct answer. This answer choice uses data from both graphs to derive a pattern about the weather or climate of the area during a specific season.
Obtaining and combining information about weather conditions is a way to gather information about the climate of different parts of the world. These graphs can be used to look for patterns. There may be connections between different months' temperature and precipitation, or there may be patterns within the months that can be used for predicting future weather. In Tampa, Florida, during the summer months, temperatures reach more than 75o F, and there are often more than six inches of rain on average each month is the correct answer. This answer choice uses data from both graphs to derive a pattern about the weather or climate of the area during a specific season.
Compare your answer with the correct one above
This graph shows the average amount of precipitation in inches in Omaha, Nebraska, since the 1940s. True or False: The average amount of rainfall has decreased since the 1940s.

This graph shows the average amount of precipitation in inches in Omaha, Nebraska, since the 1940s. True or False: The average amount of rainfall has decreased since the 1940s.
This is a bar graph that is displaying data collected for the average precipitation amount in Omaha, Nebraska, over the last 80 years. This data is obtained through measurements and recorded daily to calculate the average for each month or year; in this instance, it is by decade. Over the years, an increase in the amount of precipitation is seen. There was a drop in the 1970s and again in the 2000s, but overall when comparing the 1940s to the 2010s, there is a definite increase. Due to the information provided by the graph, the statement in the question is false.
This is a bar graph that is displaying data collected for the average precipitation amount in Omaha, Nebraska, over the last 80 years. This data is obtained through measurements and recorded daily to calculate the average for each month or year; in this instance, it is by decade. Over the years, an increase in the amount of precipitation is seen. There was a drop in the 1970s and again in the 2000s, but overall when comparing the 1940s to the 2010s, there is a definite increase. Due to the information provided by the graph, the statement in the question is false.
Compare your answer with the correct one above
Isla obtains all of the information she can about the climate in Rio de Janeiro, Brazil. She wants to organize it and display it in an easy to understand format. She collects information on their natural disasters, precipitation, temperatures, and humidity for each season of the year. What is the best format for Isla to display this information?
Isla obtains all of the information she can about the climate in Rio de Janeiro, Brazil. She wants to organize it and display it in an easy to understand format. She collects information on their natural disasters, precipitation, temperatures, and humidity for each season of the year. What is the best format for Isla to display this information?
If Isla wants to display the information in an easy to read format graphs would be the best option. Data tables can be complicated and messy when there are too many pieces of information, photographs would not help with numerical data, and an essay would not be a visual way to see the data. Graphs would help to organize the information, display trends or patterns, and make it easier to comprehend her findings.
If Isla wants to display the information in an easy to read format graphs would be the best option. Data tables can be complicated and messy when there are too many pieces of information, photographs would not help with numerical data, and an essay would not be a visual way to see the data. Graphs would help to organize the information, display trends or patterns, and make it easier to comprehend her findings.
Compare your answer with the correct one above